Is a solar installation worth it for your business?
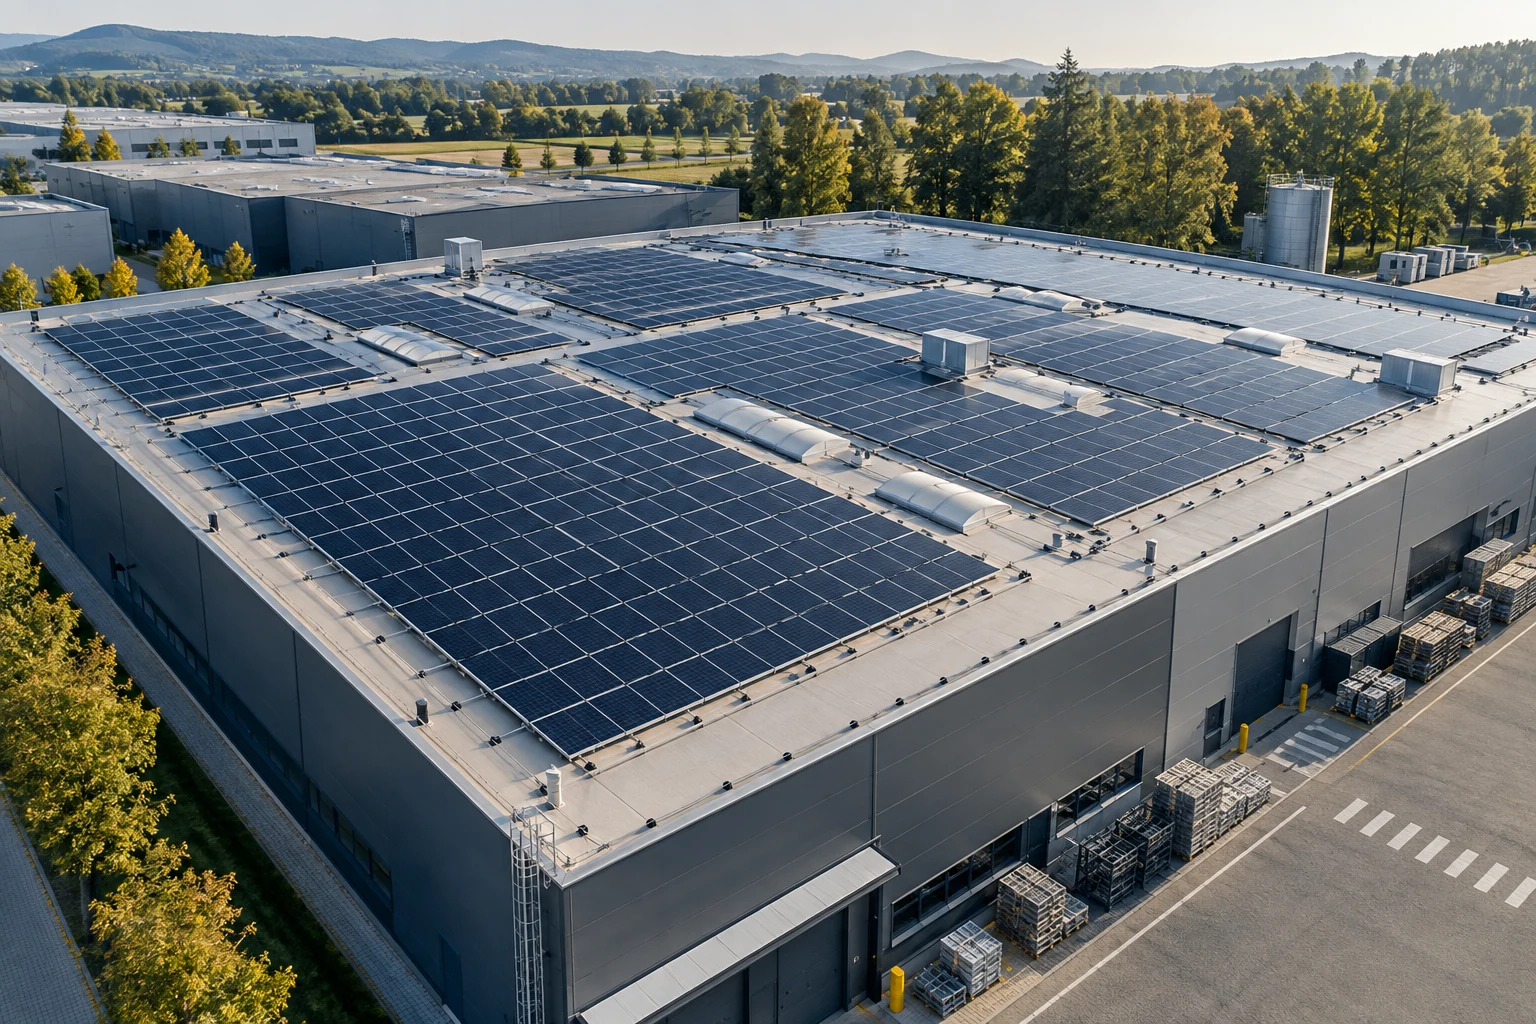
Two companies can install the same solar capacity and achieve different returns. What matters is how much electricity they use when it is generated, and which grid purchases they avoid. This illustrative example explains the calculation and the evidence to request before investing.
What does the example show?
In the example from our LinkedIn post, a business consumes 500,000 kWh of electricity annually and considers a 300 kWp installation. Assumed annual generation is 330,000 kWh, equivalent to 1,100 kWh per kWp. This is an assumption for the example, not a calculation for an identified site. Actual generation should be estimated from location, tilt, orientation, shading and system losses, using a tool such as the European Commission's PVGIS. kWp describes a panel array's rated peak power under standard test conditions; kWh measures an amount of energy.
If the business directly uses 85% of generation, it consumes 280,500 kWh on site. The remaining 49,500 kWh is not directly consumed. Export depends on technical and contractual conditions; storage or curtailment may also be relevant. This example assigns no additional value to that surplus.
330,000 kWh × 85% = 280,500 kWh used on site
280,500 kWh × €0.15/kWh = €42,075 annual value
€240,000 ÷ €42,075 ≈ 5.7 years
What does a 5.7-year payback mean?
It is a simplified ratio of initial investment to the estimated annual value of directly consumed solar electricity. The €0.15/kWh figure is an assumption. A real project must identify which bill components actually fall when grid purchases decrease. Fixed charges do not automatically disappear.
The calculation excludes surplus revenue, maintenance, insurance, financing, tax treatment, declining generation over the system's life and possible equipment replacement. Consequently, €42,075 is not net annual cash flow and 5.7 years is not a guaranteed payback period.
What changes the result most?
- Timing of consumption. Annual totals are insufficient. Generation and demand must overlap, including at weekends and during seasonal shutdowns.
- Site conditions. Orientation, shading, roof condition and connection requirements influence design and cost.
- System size. Additional panels may increase surplus more than on-site consumption.
- Prices and financing. Compare several electricity-price and cost-of-capital scenarios.
How should you prepare the investment decision?
Collect bills, available interval consumption data, grid-connection documentation and building information. Use them to compare system sizes and annual cash flows. Net present value (NPV) expresses future cash flows in today's money; internal rate of return (IRR) is another measure for comparing investments.
A sound decision uses measurable assumptions and a range of outcomes. The figures here explain the method; actual feasibility must be assessed for the specific project.
85% self-consumption does not mean 85% energy independence
The business uses 85% of solar generation. That covers 280,500 of its total 500,000 kWh demand, or 56.1% of annual electricity needs. It still needs 219,500 kWh from the grid, assuming unchanged demand and no battery. These percentages answer different questions.
The self-consumption ratio describes how much solar output is used on site. The share of demand covered describes how much purchasing is avoided. An investment decision needs both.
How sensitive is the result to electricity prices?
The table changes only the assumed value of avoided purchases. On-site solar consumption remains 280,500 kWh and investment €240,000. These are calculation scenarios, not current tariffs or price forecasts.
| Value per kWh | Annual value | Investment/value ratio |
|---|---|---|
| €0.10 | €28,050 | 8.6 years |
| €0.15 | €42,075 | 5.7 years |
| €0.20 | €56,100 | 4.3 years |
The difference is substantial even though generation is identical. A proposal with only one favourable scenario provides insufficient evidence. Include maintenance and all relevant cash flows, including financing and surplus value, in each scenario.
What if the business closes at weekends?
An 85% self-consumption assumption needs support from the operating profile. If direct consumption were 60% with the same generation, the business would use 198,000 kWh. At an assumed €0.15/kWh, that is worth €29,700 annually and the simplified investment/value ratio rises to approximately 8.1 years.
This is not a forecast of the effect of weekend closures. It illustrates why calculations must reflect actual shifts, holidays and seasonal changes instead of automatically assuming high self-consumption.
What should accompany a proposal?
- Generation assumptions: location, orientation, tilt, losses and shading treatment.
- A self-consumption calculation: which meter readings were used and how generation was matched to demand.
- A clear investment scope: design, roof and electrical works, connection and commissioning, with excluded items costed separately.
- Several economic scenarios: lower electricity prices, lower self-consumption and relevant operating costs.
- A maintenance and responsibility plan: who monitors output, responds to faults and pays for interventions.
Your first step: collect at least the last 12 months of bills and available interval data. Mark non-working days and planned operational changes. This lets you compare proposals using the same assumptions.
Based on EMISSIO TRADE's LinkedIn post published on 8 September 2026. All amounts are illustrative assumptions. Technical reference: European Commission JRC: PVGIS user manual. Network-charge structure: HEP ODS: business tariff models (Croatian). Content reviewed on 15 September 2026.